6 Key Travel Industry Growth Statistics

- Travel and tourism contributed 10.3% of global GDP and 330M jobs in 2019, ranking third in exports.
- Tourist arrivals grew from 25M in 1950 to 1.4B in 2018; Europe leads with 50%, Asia Pacific holds 25%.
- Air travel growth, rising middle class, and OTAs like Booking Holdings and Expedia fuel industry expansion.
- Luxury hotel growth in China, 400+ OTAs, 78.6% of tourism GMV from leisure, 5.5% Asia Pacific growth rate.
The travel and tourism industry is undeniably one of the biggest success stories of the last 75 years. While the world has undergone huge changes since the end of the Second World War and many industrial sectors have experienced turmoil and decline, travel and tourism have enjoyed remarkable growth.
This article presents a selection of data illustrating the expansion of the travel industry prior to Covid-19.
It acts as a necessary and timely reminder of the phenomenal contribution that travel and tourism make to the global economy. We also underline the key fundamentals that point to a return to growth in the very near future.
Travel and tourism accounted for 10.3% of global GDP and 330 million jobs, or 10.4% of total employment in 2019, according to the World Travel &Tourism Council (WTTC).
As a generator of export earnings, it comes in third place, after chemicals and fuels, and ahead of automotive products. From 2014 to 2019, 25% of all new jobs created across the world were in travel and tourism.
Chart 1: International Tourist Arrivals by World Region
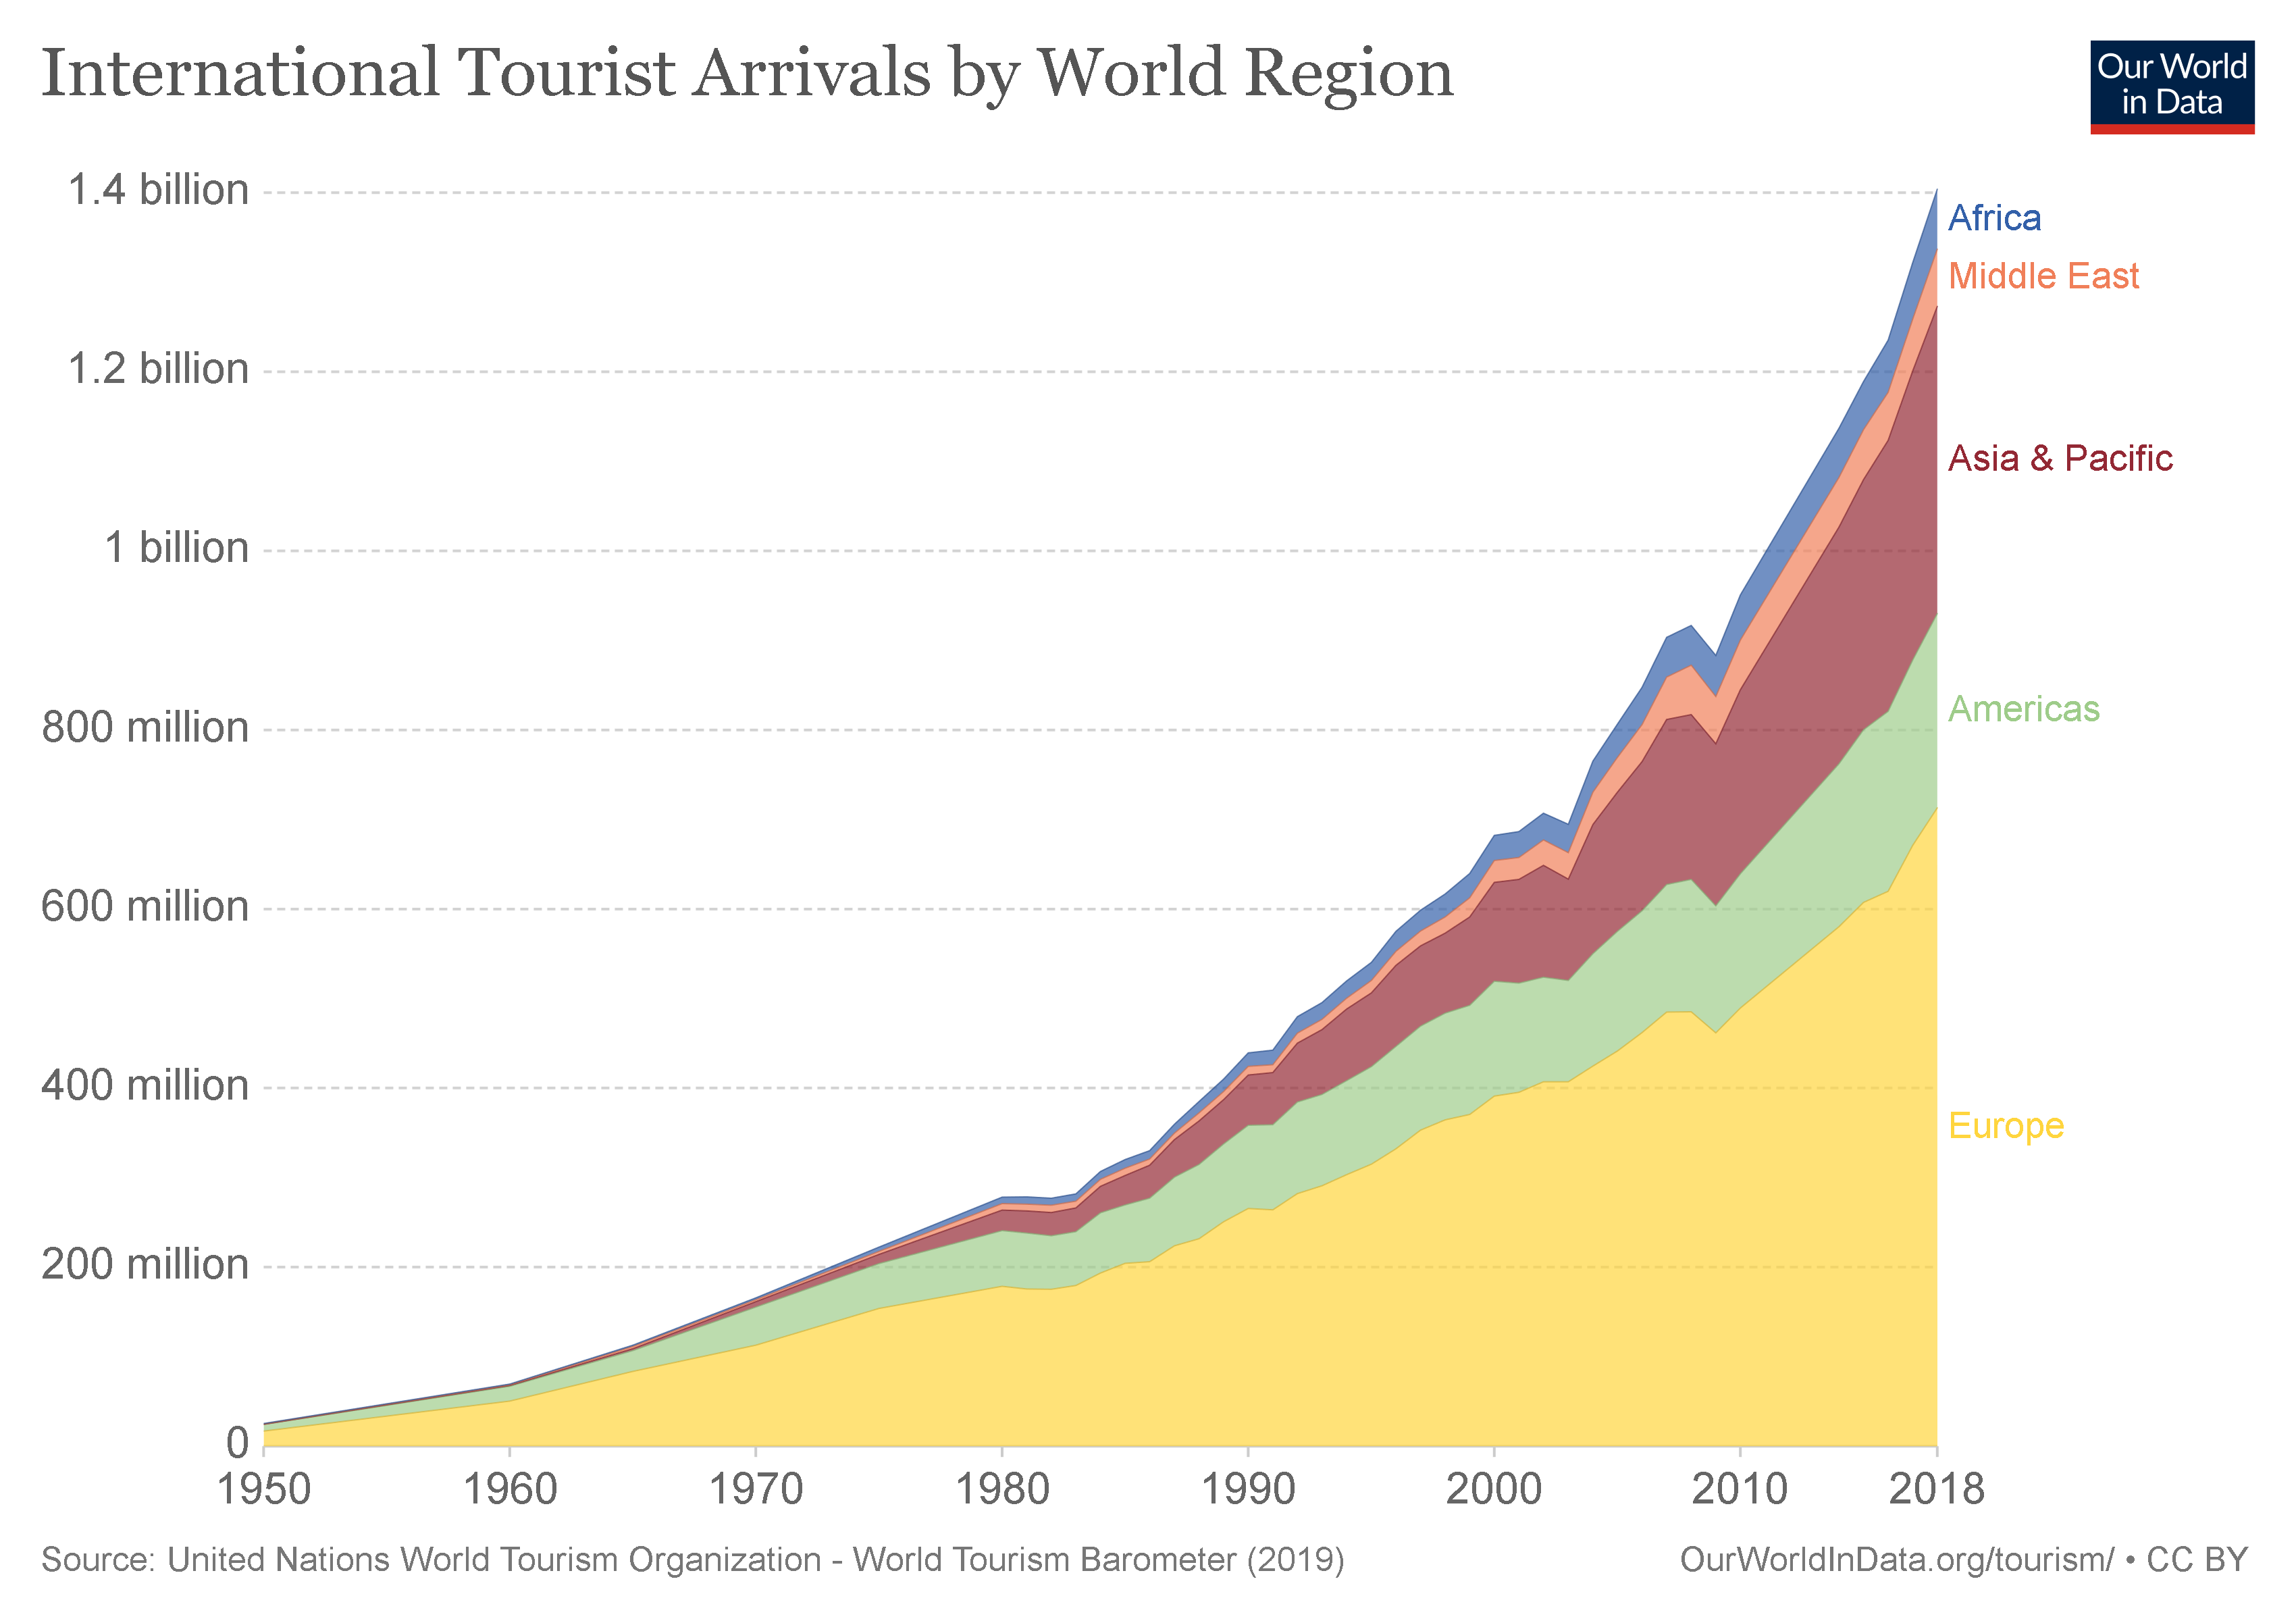
Chart 1 ( above) shows how tourist arrivals have increased since 1950. According to The United Nations World Tourism Organization (UNWTO) there were only 25 million international tourist arrivals in 1950. By 2018, that number had multiplied by 56 to 1.4 billion international arrivals.
Chart 2: The Changing Global Distribution of Tourist Arrivals.
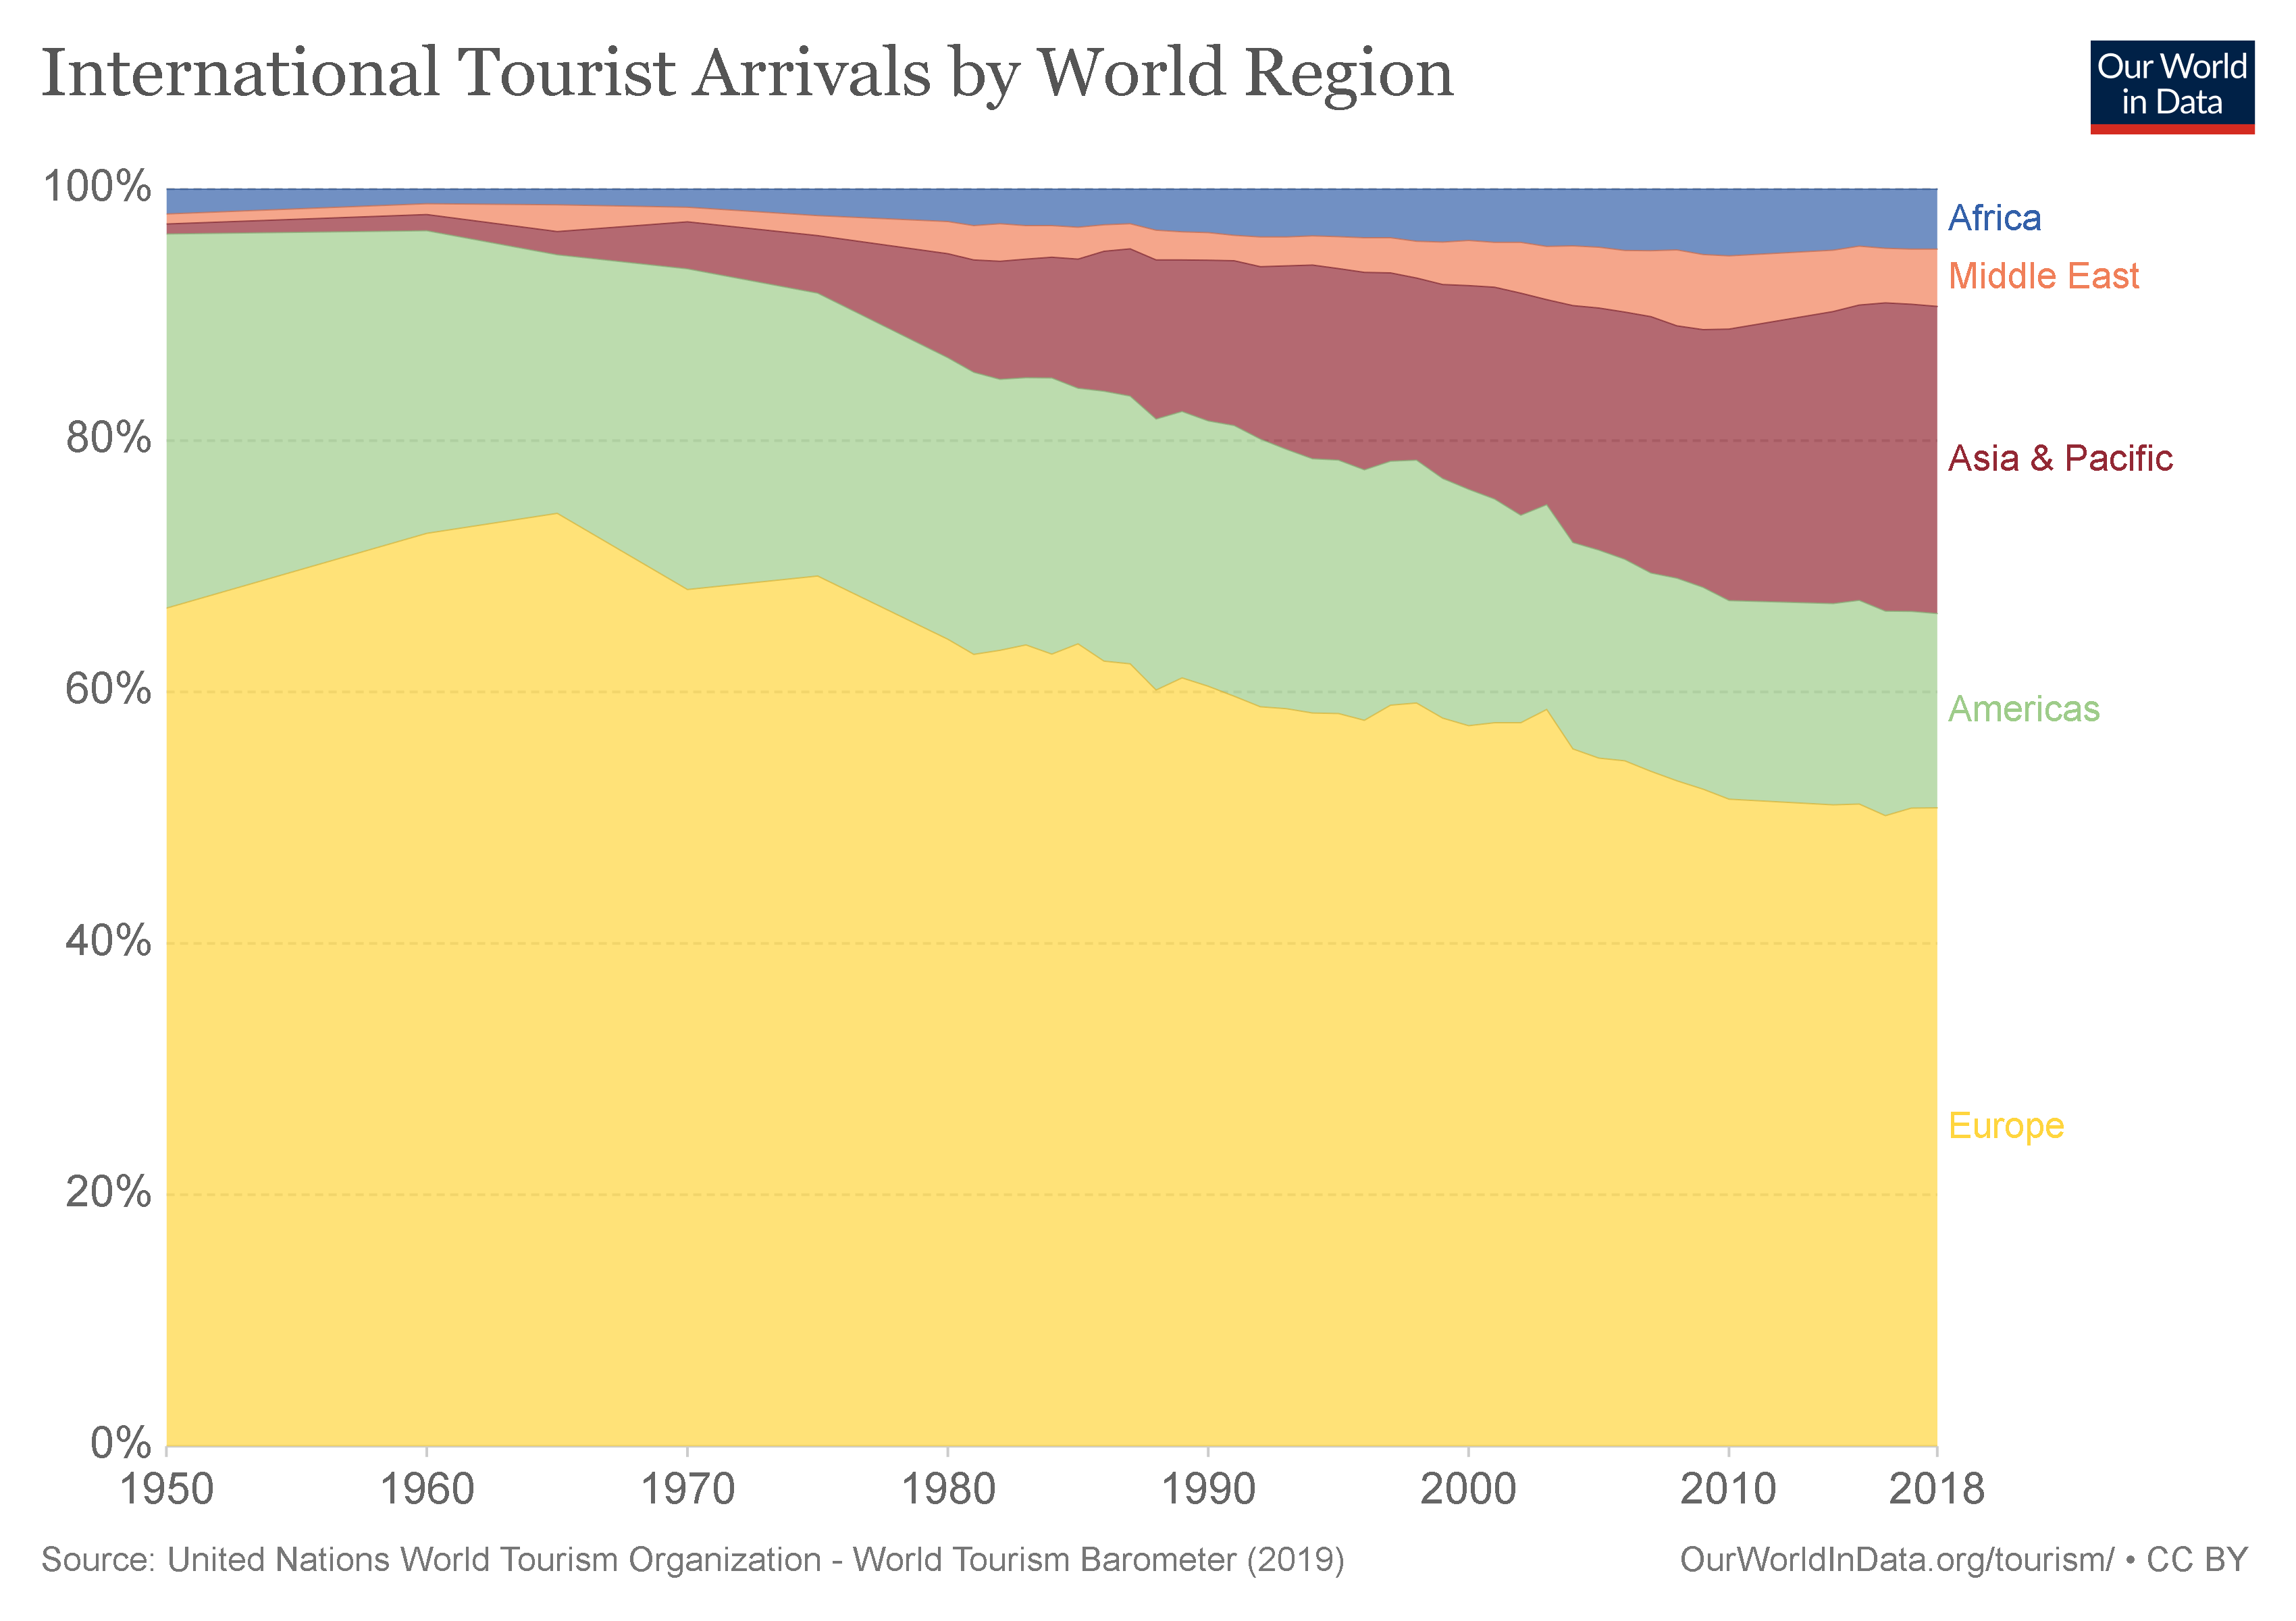
Chart 2 shows the distribution of international tourist arrivals by region. Between 1950 and 1970 around two thirds of all outbound travel was to Europe. Over time, the relative importance of Europe has decreased, although, with a 50% share it still remains the most important tourist region in the world (and Paris the most visited city).
Asia Pacific had a negligible share of tourist arrivals in 1950. Since then its importance has grown and it now accounts for around 25% of all outbound travel.
Chart 3: Number of Air Transport Passengers 1970 to 2017
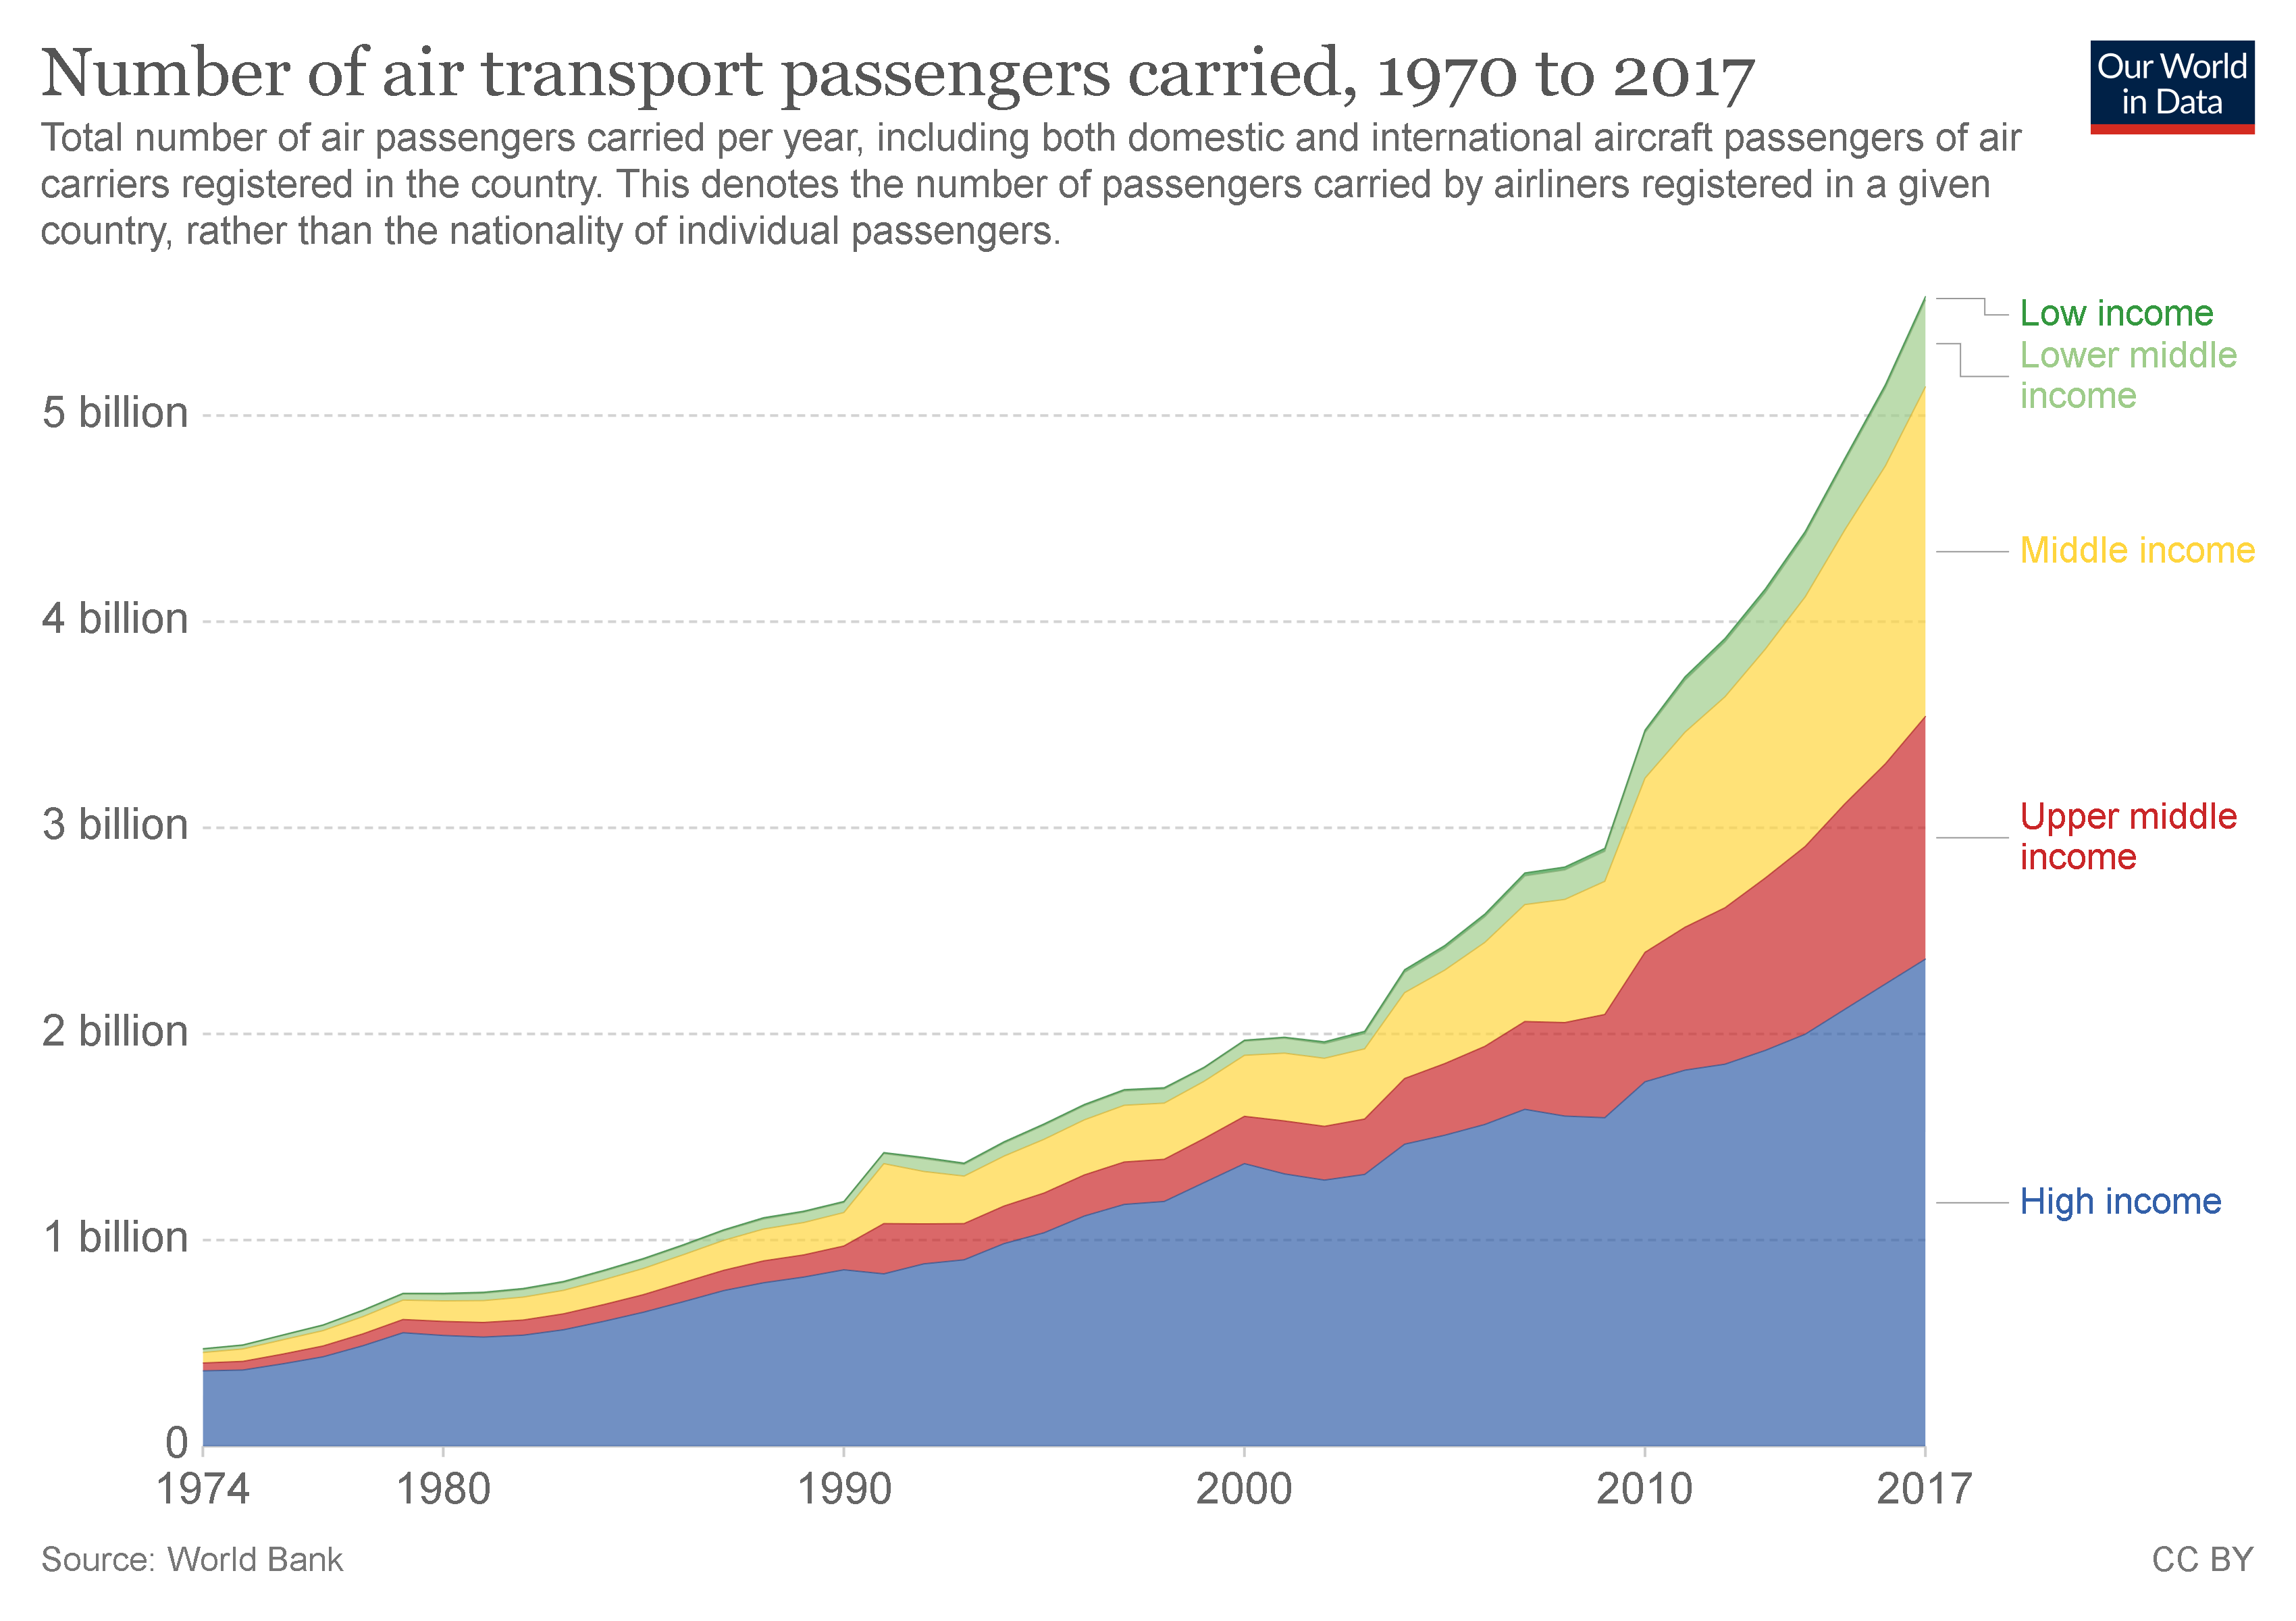
Chart 3 illustrates the growing prevalence of air travel. The graph highlights how an increase in prosperity and a rising number of middle-class households has fuelled the global population’s appetite for air travel.
Chart 4: Number of Luxury Hotel Rooms in China 2019-2023
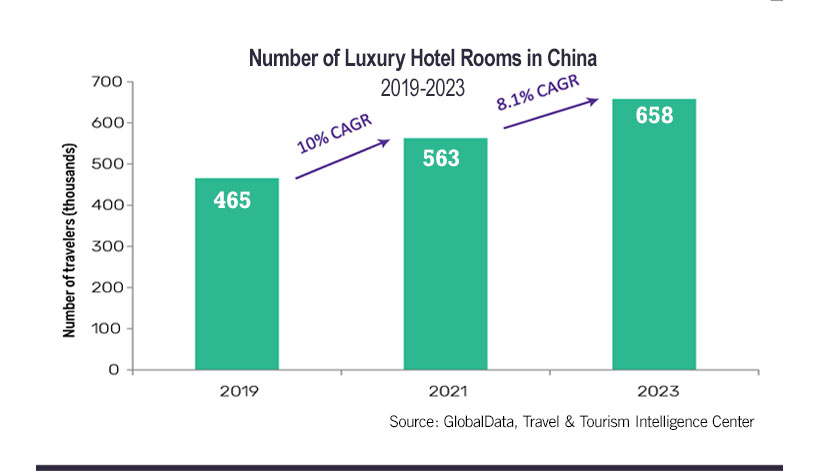
A report by Global Data on the hotel market in China underlines a correlation between the number of high net worth individuals in the country and the growth in the number of luxury hotels (see Chart 4).
The number of Chinese citizens who are worth more than one million US dollars has grown to around 4.5m today. Global Data says that this increases the likelihood of domestic tourism contributing to the majority of China’s hotel revenues.
The latest research from Lodging Econometrics confirms that Covid-19 has done nothing to slow the growth of China’s hospitality industry. China’s total hotel construction pipeline has kept on growing, reaching an all-time high of 647,704 rooms in the second quarter of 2020.
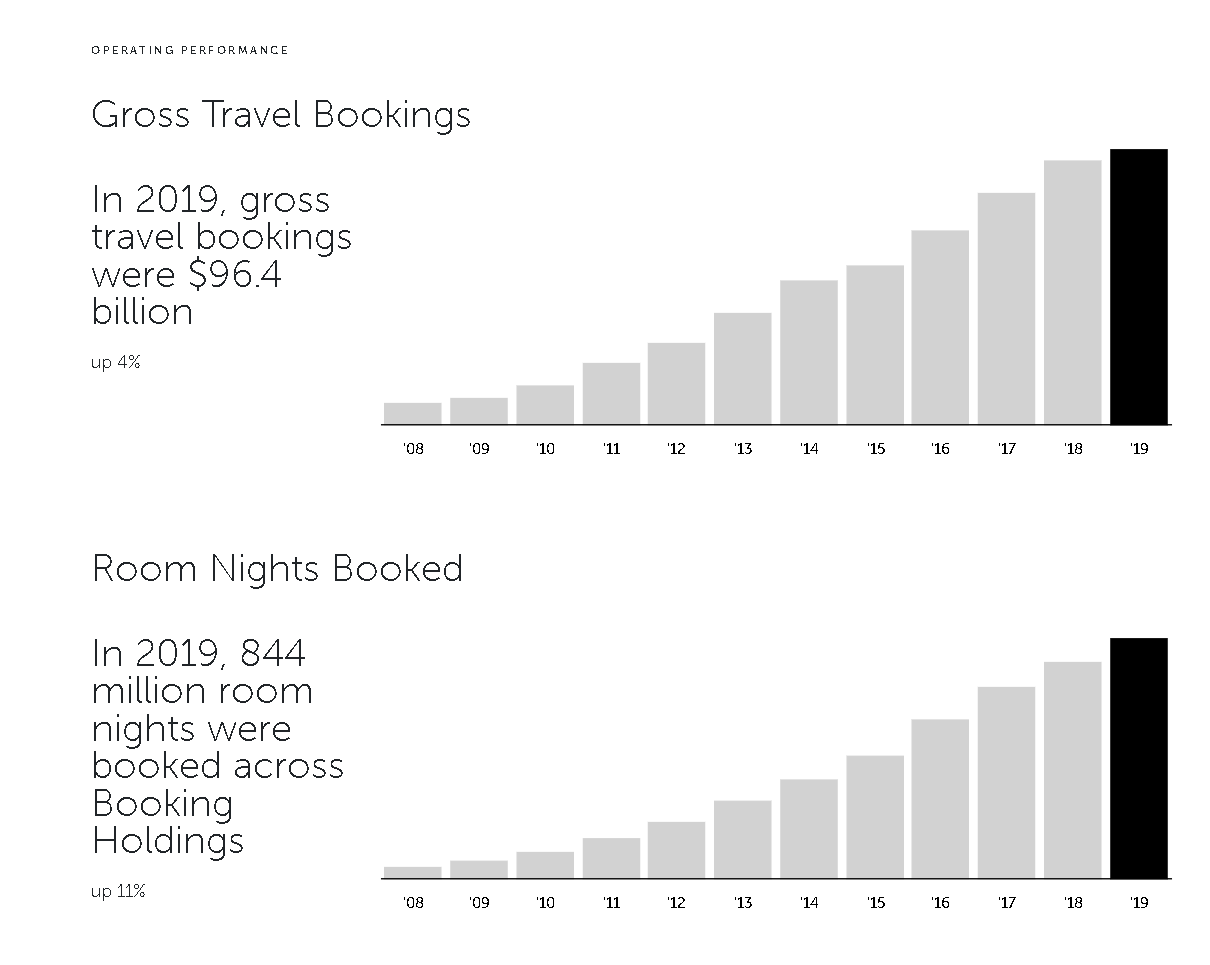
Chart 5: Booking Holdings Gross Travel Bookings and Room Nights Booked 2008 to 2019
In addition to hotel real estate needing to keep pace with our growing appetite for travel, the 21st century has witnessed the transformation of traditional travel agents and rise of online travel agencies and online hotel bookings.
There are understood to be more than 400 OTAs in operation today. The biggest players, Booking Holdings and Expedia, reportedly enjoy more than 80% of thetotal OTA market. Chart 5 shows how the online booking of trips and overnight stays has become the norm over the last few years. Gross travel bookings made via Booking Holding’s portfolio of consumer websites, for example, rose from $7.4b in 2008 to $96.4b in 2019. The number of hotel room nights booked increased from 40.8m in 2008 to 844m in 2019.
According to the WTTC, global GDP from travel and tourism grew by 3.5% in 2019, a rate higher than that of the global economy as a whole for the ninth year in a row. Asia Pacific was the fastest growing region with 5.5% growth.
Chart 6: Number of Overseas Visitors to Japan 2003 to 2020
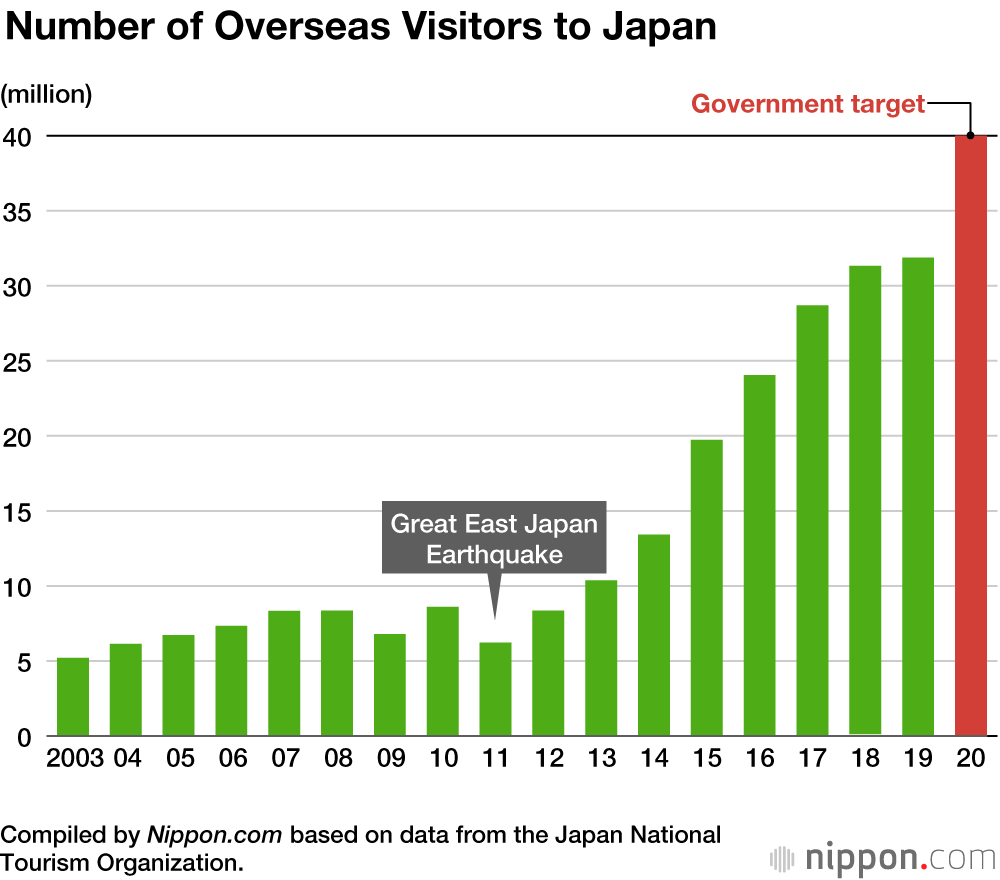
Japan, for example, welcomed 31.9m inbound visitors, a new record for the seventh consecutive year (see Chart 6). Inbound tourism spend was up 5.9% supported by the government putting tourist at the heart of its growth strategy and by the hosting of the Rugby World Cup.
Looking ahead to the return of growth
It is inevitable that travel and tourism’s remarkable rise will be affected by Covid-19. There is no getting around the hole in revenues left by four months of enforced closure during the first half of 2020.
However, domestic leisure tourism is already staging an impressive recovery in many destinations. Outbound travel is expected to follow in 2021.
On a global scale, the WTTC says that the leisure market accounts for 78.6% of total tourism gross merchandise volume (GMV), compared with 21.4% from business spend.
Subscribe to
our newsletter
Yay! You are now
subscribed to our
newsletter
Mize is the leading hotel booking optimization solution in the world. With over 170 partners using our fintech products, Mize creates new extra profit for the hotel booking industry using its fully automated proprietary technology and has generated hundreds of millions of dollars in revenue across its suite of products for its partners. Mize was founded in 2016 with its headquarters in Tel Aviv and offices worldwide.
Related Posts
The Top 25 Travel Management Companies in the US and Canada
21 min. Business travel in the US and Canada runs on a surprisingly small number of companies, and that number keeps shrinking as the biggest players buy up the rest. For a travel program owner, a supplier, or a technology partner, knowing who actually operates in this market (and who now belongs to whom) is […]

78 Most Influential Travel Industry Events in 2026
109 min. After “revenge travel” and hurried recovery, the global travel and hospitality sector can finally continue where it stopped. But first, a phase of “measured normalization”. We’ve celebrated the industry’s comeback; now, leaders and stakeholders are examining what’s next. This year, travel discussions circle around regeneration, hyper-personalization, and AI. Industry summits are the perfect […]

6 Business Travel Trends Changing 2026 Fast
16 min. After the sharp collapse in 2020 and the gradual recovery that followed, corporate travel in 2025-2026 looks very different from the industry we knew before the pandemic. Figures are recovering – global business travel spending reached $1.48 trillion in 2024 – but travel professionals are facing new complexities. Stuck between richer retail offers […]
